News Release
Financial results
FUJI OIL HOLDINGS
Announcement of the Settlement of Accounts for the Second Quarter of the Year Ending March 2016
2015.11.6
(Note) Figures shown have been rounded down to the nearest million yen
Our settlement of accounts for the second quarter of the year ending March 2016 was announced on the afternoon of Friday, November 6 at the Tokyo Stock Exchange Press Club. An outline of the accounts is presented below.
Consolidated Results for the Second Quarter of the Year Ending March 2016 (April 1, 2015 to September 30, 2015)
Consolidated operating results (total)
(% is in comparison to the previous year)
| Net sales | Operating income | Ordinary income | Net income attributable to shareholders of parent company for quarter | |||||
|---|---|---|---|---|---|---|---|---|
| (millions of yen) | (%) | (millions of yen) | (%) | (millions of yen) | (%) | (millions of yen) | (%) | |
| Second quarter of the year ending March 2016 | 134,098 | 4.7 | 6,436 | 0.2 | 5,926 | (7.5) | 3,622 | (22.7) |
| Second quarter of the year ending March 2015 | 128,115 | 8.0 | 6,421 | (0.2) | 6,403 | 0.5 | 4,684 | 20.3 |
- *Comprehensive income:
-
- 2Q for year ending March 2016: 2,489 million yen (-48.1%)
- 2Q for year ending March 2015: 4,801 million yen (-46.2%)
Overview of the second quarter of the year ending March 2016
The Japanese economy during the company’s first half of the fiscal year saw a continued moderate recovery due to financial and fiscal policies by the government and the Bank of Japan. Overseas, however, due to the effect of slower growth in China and other developing countries and concerns about higher interest rates resulting from financial measures in the United States, fears of a slow down in the global economy grew and lead to the continuation of a state of uncertainty.
The domestic food industry in which our group is placed continued to face adverse business conditions as a result of sustained high raw material prices following the continuation of the weak yen.
Against this backdrop, our rolling midterm management plan called “Renaissance Fuji 2017” (April 2015 - March 2018) sets forth “promotion / acceleration of global management”, “promotion / acceleration of technological management” and “promotion / acceleration of sustainable management” as our fundamental policies and we have been enhancing operational strength through growth strategy, profit structure reform, and the construction of a supply chain, and engaging in product development fitting the needs of customers, delivering high-functionality ingredients.
As a result, for the first half of the year ending March 2016, we achieved net sales of 134,098 million yen (increase of 4.7% y-o-y), operating income of 6,436 million yen (increase of 0.2% y-o-y), ordinary income of 5,926 million yen (decrease of 7.5% y-o-y) and net income attributable to shareholders of parent company of 3,622 million yen (decrease of 22.7% y-o-y).
Overviews by division are as follows:
Oils and Fats Processing Division
| FY2014 Q2 Total | FY2015 Q2 Total | Comparison to the previous year | ||
|---|---|---|---|---|
| Difference (amount) | Difference (ratio) | |||
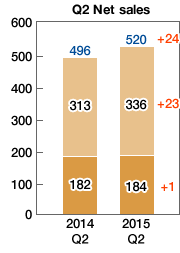
| Net sales | 496 | 520 | +24 | +4.9% |
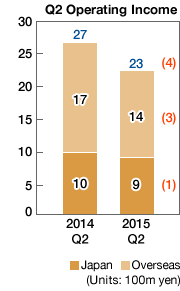
| Operating income | 27 | 23 | (4) | (15.3%) |
Domestically, sales of frying oil, coconut oil for confectionery oils and fats, palm oil, and hard butters for chocolate progressed strongly, but in terms of profits, factors such as reduced retail prices and increased costs led to lower profit.
Overseas, however, declining raw material market prices led to lower retail pricing, but sales increased overall due to factors including extended sales mainly in the Americas and favorable yen conversion rates due to the weakened yen. In terms of profit, overall profits from overseas decreased due to factors including reduced profits in Europe.
Through these results, this division achieved a sales volume of 51,989 million yen (4.9% y-o-y increase) and an operating income of 2,268 million yen (15.3% y-o-y decrease).
Confectionery and Bakery Ingredients Division
| FY2014 Q2 Total | FY2015 Q2 Total | Comparison to the previous year | ||
|---|---|---|---|---|
| Difference (amount) | Difference (ratio) | |||
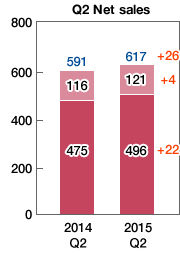
| Net sales | 591 | 617 | +26 | +4.4% |
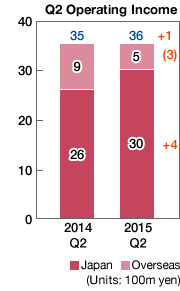
| Operating income | 35 | 36 | +1 | +2.5% |
Domestically, chocolates centering on sweet chocolates grew, leading to increased sales. Creams and prepared products saw decreased sales, but sales of margarines, shortenings, and fillings increased, leading to increased net sales for this division in Japan. In terms of profits, increased profits were seen due to increased sales and sales price revisions, despite increasing raw material prices.
Overseas, sales of chocolate, cream, margarine, and fillings progressed steadily, resulting in a sales increase. In terms of profits, a decrease was seen due to an increase in costs resulting from the accrual of costs related to the stock acquisition of the Brazilian consolidated subsidiary Harald.
Through these results, this division achieved a sales volume of 61,710 million yen (increase of 4.4% y-o-y) and an operating income of 3,552 million yen (increase of 2.5% y-o-y).
Soy Protein Division
| FY2014 Q2 Total | FY2015 Q2 Total | Comparison to the previous year | ||
|---|---|---|---|---|
| Difference (amount) | Difference (ratio) | |||
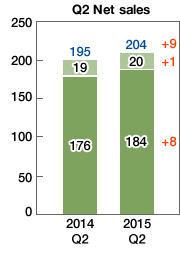
| Net sales | 195 | 204 | +9 | +4.9% |
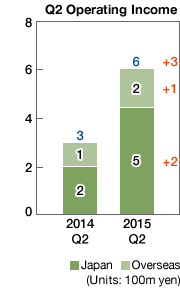
| Operating income | 3 | 6 | +3 | +123.3% |
Soy protein ingredients saw declines in sales for meat and fisheries, but sales progressed for health foods, prepared foods, and processed foods, resulting in an overall sales increase. Functional food ingredients improved in sales following extended sales in products for beverages. Soy protein products saw lower sales in products for instant noodles, catering foods and the fishery market. Sales of soy milk increased as sales of soy milk beverages and other products progressed steadily. As such, the division saw an overall increase in sales. Profits increased due to factors including increased profits from sales growth and cost reductions.
Through these results, this division achieved a sales volume of 20,398 million yen (increase of 4.9% y-o-y) and an operating income of 615 million yen (increase of 123.3% y-o-y).
Predictions for Consolidated Results for the Year Ending March 2016 (April 1, 2015 to March 31, 2016)
Based on recent performance trends, the results forecast announced on May 8, 2015 has been modified as follows.
| Net sales | Operating income | Ordinary income | Net income attributable to shareholders of parent company | Net income per share | |
|---|---|---|---|---|---|
| (millions of yen) | (millions of yen) | (millions of yen) | (millions of yen) | (yen) | |
| Previous forecast (A) | 300,000 | 16,000 | 15,600 | 10,000 | 116. 33 |
| Revised forecast (B) | 300,000 | 16,000 | 14,400 | 9,500 | 110. 52 |
| Difference (B-A) | - | - | (1,200) | (500) | - |
| Difference ratio (%) | - | - | (7.7) | (5.0) | - |
| (Reference) Results from previous year (Year ending March 2015) | 271,903 | 14,211 | 13,405 | 9,330 | 108. 55 |
*Qualitative information regarding forecast consolidated figures
Throughout the period we have continued to make efforts to expand sales, revise sale prices, and reduce costs, and there are no changes in terms of the previous forecast of sales or operating income. However, it is forecast that our current-account balance shall deteriorate due to exchange appraisal losses occurring in the foreign currency denominated claims and obligations (foreign currency denominated loans and debts, etc.) held by the Fuji Oil Group because of weak currencies in developing countries.
As such, ordinary income and net income attributable to shareholders of parent company is expected to be lower than the previous forecast.
*The forecasts above have been made based on information available at the time of this announcement.
The actual results may differ from these forecasts due to various factors.
End of report
More Detail
Overview of Consolidated Profits and Losses
(Units: 100m yen)
| FY2014 Q2 Total | FY2015 Q2 Total | Comparison to the previous year | |||
|---|---|---|---|---|---|
| Difference (amount) | Difference (ratio) | ||||
| Net sales | Oils and Fats | 496 | 520 | +24 | +4.9% |
| Confectionery and Bakery Ingredients | 591 | 617 | +26 | +4.4% | |
| Soy Protein | 195 | 204 | +9 | +4.9% | |
| Total | 1,281 | 1,341 | +60 | +4.7% | |
| Operating income | Oils and Fats | 27 | 23 | (4) | (15.3%) |
| Confectionery and Bakery Ingredients | 35 | 36 | +1 | +2.5% | |
| Soy Protein | 3 | 6 | +3 | +123.3% | |
| Total | 64 | 64 | +0 | +0.2% | |
| Operating income ratio | 5.0% | 4.8% | (0.2p) | - | |
| Ordinary income | 64 | 59 | (5) | (7.5%) | |
| Net income attributable to shareholders of parent company for quarter | 47 | 36 | (11) | (22.7%) | |
| Comprehensive income for quarter | 48 | 25 | (23) | (48.1%) | |
Consolidated Profits and Losses by Area
(Units: 100m yen)
| FY2014 Q2 Total | FY2015 Q2 Total | Comparison to the previous year | |||
|---|---|---|---|---|---|
| Difference (amount) | Difference (ratio) | ||||
| Net sales | Japan | 833 | 864 | +31 | +3.8% |
| Asia | 259 | 261 | +2 | +0.6% | |
| Europe and North America | 189 | 216 | +27 | +14.1% | |
| Total | 1,281 | 1,341 | +60 | +4.7% | |
| Operating income | Japan | 38 | 43 | +6 | +14.6% |
| Asia | 14 | 21 | +7 | +52.0% | |
| Europe and North America | 11 | 4 | (7) | (65.5%) | |
| Elimination | +1 | (4) | (6) | - | |
| Total | 64 | 64 | +0 | +0.2% | |
[Summary of Results]
Japan:
Increased sales and profits through increased sales of confectionery and bakery ingredients and soy protein.
Asia:
Increased profits through increased sales of chocolate, creams, and margarines.
Europe and North America:
Lower profits were recorded due to decreased profits in Europe and the accrual of costs related to the acquisition of Harald.
Consolidated Balance Sheet
(Units: 100m yen)
| FY2014 end of year | FY2015 end of Q2 | Comparison to the previous end of year | Main factors for increase/ decrease | |
|---|---|---|---|---|
| Current assets | 1,186 | 1,287 | +101 | Gain of assets from new consolidation of Harald, etc. |
| Fixed assets | 1,051 | 1,369 | +319 | Accrued amortization due to new consolidation of Harald and gained assets, etc. |
| Total assets | 2,236 | 2,656 | +420 | |
| Interest-bearing liabilities | 296 | 622 | +327 | Increase in loans due to acquisition of Harald, etc. |
| Other liabilities | 432 | 513 | +80 | |
| Total liabilities | 728 | 1,135 | +407 | |
| Total net assets | 1,508 | 1,521 | +13 | Increased in retained earnings, decrease in valuation difference on available-for-sale securities, etc. |
Consolidated Full Year Forecast by Segment
(Units: 100m yen)
| 2014 Q2 Total | 2014 full year | 2015 Q2 Total | Year-on-year comparison | 2015 full year forecast | Year-on-year comparison | ||
|---|---|---|---|---|---|---|---|
| Net sales | Oils and Fats | 496 | 1,048 | 520 | +24 | 1,124 | +75 |
| Confectionery and Bakery Ingredients | 591 | 1,276 | 617 | +26 | 1,461 | +184 | |
| Soy Protein | 195 | 394 | 204 | +9 | 416 | +22 | |
| Total | 1,281 | 2,719 | 1,341 | +60 | 3,000 | +281 | |
| Operating income | Oils and Fats | 27 | 53 | 23 | (4) | 53 | +0 |
| Confectionery and Bakery Ingredients | 35 | 87 | 36 | +1 | 98 | +11 | |
| Soy Protein | 3 | 2 | 6 | +3 | 9 | +7 | |
| Total | 64 | 142 | 64 | +0 | 160 | +18 | |
(Note) No revisions have been made for sales and operating income for the consolidated full year forecast announced on Friday, May 8, 2015. Full year forecasts for the consolidated sales by segment and operating income breakdown figures have been changed based on the recent performance trends.
