News Release
Financial results
FUJI OIL HOLDINGS
Announcement of the Settlement of Accounts
2002.5.17
Announcement of the Settlement of Accounts for the Year Ending March 2002.
On May 16, we announced the settlement of consolidated and non-consolidated accounts for the year ending March 2002 at the Tokyo and Osaka Stock Exchange Press Clubs. An outline of which is given below.
(Note) Figures shown have been rounded down to the nearest million yen.
Settlement of Consolidated Accounts
Consolidated Results for the Fiscal Year Ending March 2002
(April 1, 2001 to March 31, 2002)
(1) Conditions of the Consolidated Results for the Fiscal Year
The business environment in Japan was harsh due to sharp rises in raw material markets compounded with the depreciating yen, due to competition for lower prices by deflation amid sluggish domestic demand, and due to increased anxiety in consumers regarding product quality in food industries. Nevertheless, the Fuji Group earned favorable results throughout the fiscal year, especially in the specialty good markets such as confectionery and pastry materials and functional oils and fats, through the development of new products and the strong business initiatives. The results show total sales of 151,094 million yen (up 5.4%) and an ordinary income of 11,557 million yen (up 0.3%), beating all previous results.
(2) Consolidated Operation Results
(%) is an increase or decrease compared to the previous year.
| Net sales | Operating income | Ordinary income | Net income for the year | |||||
|---|---|---|---|---|---|---|---|---|
| (millions of yen) | (%) | (millions of yen) | (%) | (millions of yen) | (%) | (millions of yen) | (%) | |
| Year ending March 2002 | 151,094 | (5.4) | 12,329 | (-3.6) | 11,557 | (0.3) | 4,051 | (10.1) |
| Year ending March 2001 | 143,414 | (1.2) | 12,788 | (33.4) | 11,517 | (34.1) | 3,680 | (-14.8) |
| Ratio of net income on stockholders equity (%) | Ratio of ordinary income to total capital (%) | Ratio of ordinary income to net sales (%) | |
|---|---|---|---|
| Year ending March 2002 | 6.3 | 8.3 | 7.6 |
| Year ending March 2001 | 5.9 | 8.6 | 8.0 |
Consolidated Results Forecast for the Year Ending March 2003
(April 1, 2002 to March 31, 2003)
| Net sales (millions of yen) | Ordinary income (millions of yen) | Net income for the year (millions of yen) | |
|---|---|---|---|
| Mid term | 76,000 | 5,000 | 2,200 |
| Yearly | 158,000 | 11,500 | 5,500 |
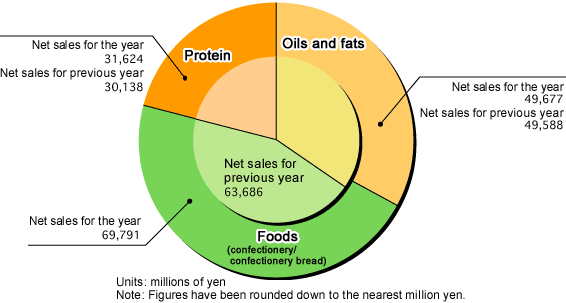
Segmented Pie Chart Showing Consolidated Information

Oils and Fats Division
Looking at the domestic market, our sales of specialty products such as functional oils and fats showed an increase. This increase was achieved despite the difficulty in earning a profit margin due to a rise in raw material costs amid the mood of deflation caused by the prolonged economic slump. The increase can be attributed to the efforts of business proposals and sales promotions for new products.
In oversea markets, all of the group companies in Singapore, Malaysia, and China earned good sales in specialty products, resulting in a profit increase. The group companies in Europe and the Philippines, which experienced tough seasons last year, turned into the surplus account owing to their efforts in productivity improvement and cost reduction. The group company in the U.S. attained a significant improvement in profitability over the previous year.
Confectionery and Baking Ingredients Division
Material and ingredient chocolate for confectionery and pastry markets showed a favorable result throughout the fiscal term. The Kanto Chocolate Plant, which started full-scale operation in August last year as scheduled, has been running as a business base in the Kanto area. Cream, cheese, and margarine materials continued to show a favorable result owing to the development of new products aimed at meeting customer demands, such as custard creams using our fermentation technology, as well as the promotion of business proposals. Frozen Pie crust/dough and Bechamel sauce base produced in our group company in Singapore also showed a favorable result due to the development of new products by application, despite the net profit reduction caused by the sluggish financial restoration of our newly consolidated sales subsidiary.
Soy Protein Division
Soy protein processed foods showed a favorable result because of sales promotions using the slogan "Let's take everyday, soy health." The healthy impression given by Soy was accepted by customers.
The group companies in Japan experienced a tough year since their sales were decreased due to the intensified sales competition.
In August last year, the Tsukuba Soy Protein Foods Plant, a business base for soy protein processed foods in the Kanto area, started full-scale operation on schedule. However, the company that manages this plant experienced a tough year to make up for the start up loss. Despite the impact of BSE problem disease in Japan, soy protein ingredients continued to show a favorable result mainly in the ham and sausage market through the development of new products and proposal-based sales promotions.
The group companies in China earned a substantial increase in the number of sales because of their reputation for high quality and their proposal-based sales promotions. Their facilities were in full-scale operation with an annual production capacity expanded from 5,000 to 8,000 tons to meet the increased domestic demand.
Water-soluble soy polysaccharides extracted from "okara" were favored as a functional food ingredient mainly in the drink, noodle, and rice markets in Japan and in the drink markets overseas.
"Soy Peptide" showed a remarkable increase in the number of sales, due to increased interests in the health preservation effects of amino acids, as well as secure and safe feelings toward soybeans.
"Soymilk" products also showed a remarkable sales increase because the nutritional functions of soybeans and soymilk were recognized in markets, supported by the sense of security to vegetable products.
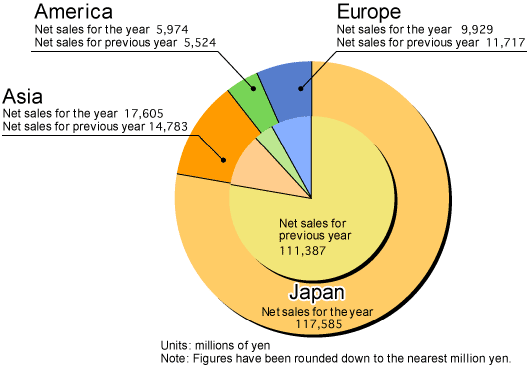
(2) Segmented Pie Chart Showing Regional Differences (Net Sales for Foreign Customers)

Prospects for the Next Year
In Japan where deflation persists, the rise in material costs and the effects of the high yen make the outlook for business unfavorable on the profitability front. Amid such a harsh business environment, Fuji Group will continue to grapple positively with expanding the sales of high value-added specialty products, cost reduction, and more. Based on the above, we forecast our net sales to be 158 billion yen, ordinary profit to be 11.5 billion yen, and current net profit to be 5.5 billion yen for the next fiscal term.
Non-consolidated Settlement of Accounts
1. Results for the Year Ending March 2002
(April 1, 2001 to March 31, 2002)
(1) Non-consolidated Operation Results
(%) is an increase or decrease compared to the previous year.
| Net sales | Operating income | Ordinary income | Net income for the year | |||||
|---|---|---|---|---|---|---|---|---|
| (millions of yen) | (%) | (millions of yen) | (%) | (millions of yen) | (%) | (millions of yen) | (%) | |
| Year ending March 2002 | 98,725 | (3.2) | 10,049 | (-13.3) | 9,915 | (-10.3) | 3,797 | (506.6) |
| Year ending March 2001 | 95,706 | (0.8) | 11,587 | (32.0) | 11,054 | (25.7) | 626 | (-79.2) |
| Ratio of net income on stockholders equity (%) | Ratio of ordinary income to total capital (%) | Ratio of ordinary income to net sales (%) | |
|---|---|---|---|
| Year ending March 2002 | 5.6 | 8.1 | 10.0 |
| Year ending March 2001 | 0.9 | 9.4 | 11.6 |
(2) Dividend
March 2002 term-end 6.00 yen; Mid-term 6.00 yen, Total 12.00 yen
2. Predictions for Non-consolidated Results for the Year Ending March 2003
(April 1, 2002 to March 31, 2003)
| Net sales (millions of yen) | Operating income (millions of yen) | Ordinary income (millions of yen) | |
|---|---|---|---|
| Mid term | 49,000 | 4,000 | 2,000 |
| Yearly | 103,000 | 9,900 | 5,000 |
End of report