News Release
Financial results
FUJI OIL HOLDINGS
Announcement of the Settlement of Accounts
2001.5.17
Announcement of the Settlement of Accounts for the Year Ending March 2001.
On May 17, we announced the settlement of consolidated and non-consolidated accounts for the year ending March 2001 at the Tokyo and Osaka Stock Exchange Press Clubs. An outline of which is given below.
(Note) Figures shown have been rounded down to the nearest million yen.
Settlement of Consolidated Accounts
Consolidated Results for the Fiscal Year Ending March 2001 (April 1, 2000 to March 31, 2001)
(1) Conditions of the Consolidated Results for the Fiscal Year
The influence of the high yen and fall in the buying market price of raw materials saw market retail prices for goods decrease, but with the general improvement in conditions for specialty goods, net sales reached 143,414 million yen (an increase of 1.2 percent on the previous year).
On the profit side, operating income was 12,788 million yen (an increase of 33.4 percent on the previous year), ordinary income was 11,517 million yen (an increase of 34.1 percent on the previous year), beating all previous results.
Regarding net income for the year, a change in the accounting standard of 3.7 billion yen related to retirement pay obligations meant a lump sum reduction in profits of 3.68 billion yen (a decrease of 14.8 percent on the previous year).
(2) Consolidated Operation Results
(%) is an increase or decrease compared to the previous year.
| Net sales | Operating income | Odinary income | Net income for the year | |||||
|---|---|---|---|---|---|---|---|---|
| (millions of yen) | (%) | (millions of yen) | (%) | (millions of yen) | (%) | (millions of yen) | (%) | |
| Year ending March 2001 | 143,414 | (1.2) | 12,788 | (33.4) | 11,517 | (34.1) | 3,680 | (-14.8) |
| Year ending March 2000 | 141,748 | (10.1) | 9,585 | (64.8) | 8,590 | (85.1) | 4,319 | (170.4) |
| Ratio of net income on stockholders equity (%) | Ratio of ordinary income to total capital (%) | Ratio of ordinary income to net sales (%) | |
|---|---|---|---|
| Year ending March 2001 | 5.9 | 8.6 | 8.0 |
| Year ending March 2000 | 7.2 | 6.6 | 6.1 |
Consolidated Results Forecast for the Year Ending March 2002 (April 1, 2001 to March 31, 2002)
| Net sales (millions of yen) | Ordinary income (millions of yen) | Net income for the year (millions of yen) | |
|---|---|---|---|
| Yearly | 150,000 | 11,500 | 6,000 |
Segmented Pie Chart Showing Consolidated Information
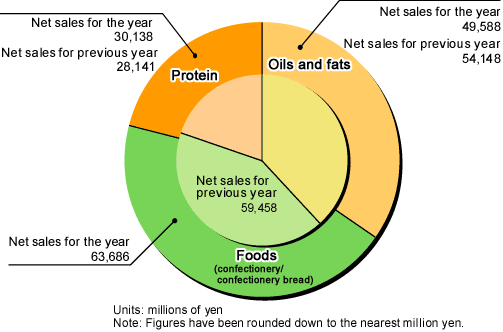
(1) Segmented by Division (April 1, 2000 to March 31, 2001)

Oils and Fats division
Overall, the number of sales and net sales fell in the domestic market. This is due to the drawn out slump in individual consumption, the effect of the high yen on main imported raw material, and falls in the buying market price and market retail price. However, our specialty goods such as functional, fry use, and processed oils and fats, centered around the promotion of business proposals aimed at the development of new uses and products, saw an increase in number of sales and improvement on the profitability front.
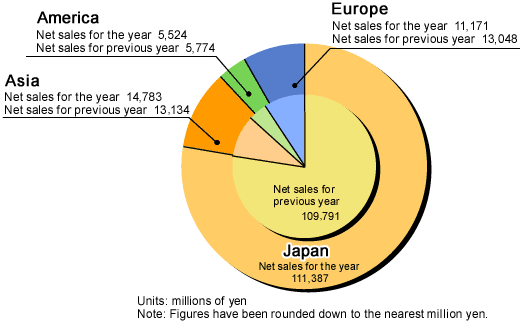
Abroad, the Singapore business group saw favorable changes in specialty goods with a background of economic recovery in South-East Asia.
The China business group saw an increase in number of sales and net sales, with operating income staying in the black throughout the year.
The American and European business groups increased the number of sales for specialty goods but overall saw a fall in income and profits due to fierce sales competition.
Foods division
With the healthy image of polphenol and so on penetrating the consumer conscience, every type of material/ingredient chocolate for confectionery and confectionery bread use saw successive improvements.
The development of new products, the development of new markets, and the stimulus of business initiatives saw positive changes for every kind of cream and margarine materials.
All confectionery use frozen piecrusts and bechamel sauce items produced by the Singapore business group saw improvements in every kind of confectionery preparation.
Protein division
Soy burgers, ganmo, kinchaku, shinoda, atsuage, frozen tofu and other soy protein processed foods for industrial use saw a fall in sales. However, domestic and foreign business groups, with the help of new products, saw successive improvements in sales.
Water-soluble soy polysaccharides extracted from okara have been well received with their many functional uses in foods and they showed improvements centering on the drink, noodle and rice markets.
Material use soy protein failed to make progress in the domestic ham and sausage market and showed an overall decrease. Abroad however, the China business group has been highly appraised for quality and strong business initiatives and showed successive improvements.
(2) Segmented Pie Chart Showing Regional Differences (Net Sales for Foreign Customers)

Prospects for the Next Year
In an environment of depressed individual consumer spending, the outlook is for a continuation of this drawn out difficult situation. In the midst of this situation, our group has adopted a mid-term operations plan reaching through to 2002 under the slogan "A Challenge for new growth for the 21 Century." The fundamental theme of the Fuji business group effort will be to take on expansion of sales in the China and Asian markets and the expansion of sales for soy related products.
Non-consolidated Settlement of Accounts
1. Results for the Year Ending March 2001 (April 1, 2000 to March 31, 2001)
(1) Non-consolidated Operation Results
(%) is an increase or decrease compared to the previous year.
| Net sales | Operating income | Odinary income | Net income for the year | |||||
|---|---|---|---|---|---|---|---|---|
| (millions of yen) | (%) | (millions of yen) | (%) | (millions of yen) | (%) | (millions of yen) | (%) | |
| Year ending March 2001 | 95,706 | (0.8) | 11,587 | (32.0) | 11,054 | (25.7) | 626 | (-79.2) |
| Year ending March 2000 | 94,951 | (-0.6) | 8,775 | (72.6) | 8,797 | (71.9) | 3,013 | (35.8) |
| Ratio of net income on stockholders equity (%) | Ratio of ordinary income to total capital (%) | Ratio of ordinary income to net sales (%) | |
|---|---|---|---|
| Year ending March 2001 | 0.9 | 9.4 | 11.6 |
| Year ending March 2000 | 4.6 | 7.7 | 9.3 |
(2) Basic Policy Regarding Profit Distribution
We have been paying dividends yearly since 1967. In the future, we are strengthening ourselves for global competition, while also working to increase the value of the business for all company steak holders: the customer, the client, the shareholder, and the employee.
For this year an allotment of 10 yen per share (of that, the end dividend is 5 yen) is planned.
For the next year an increased allotment of 12 yen per share is expected (of that, the end dividend is 6 yen).
2. Predictions for Non-consolidated Results for the Year Ending March 2002 (April 1, 2001 to March 31, 2002)
| Net sales (millions of yen) | Operating income (millions of yen) | Ordinary income (millions of yen) | |
|---|---|---|---|
| Mid term | 46,000 | 4,500 | 2,500 |
| Yearly | 98,000 | 10,500 | 5,500 |
- (reference) The planned yearly dividend for one share is 12 yen; 6 yen mid-term, 6 yen end-of-year.
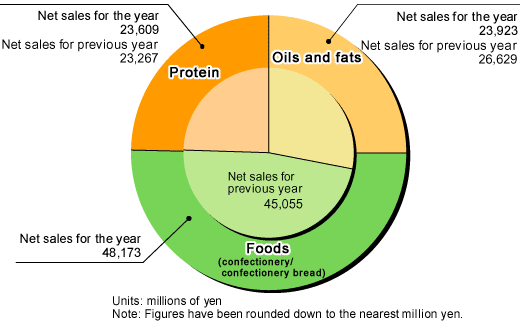
3. Net Sales by Division (April 1, 2000 to March 31, 2001)
Net sales for the food department that makes confectionery and confectionery bread materials has shown yearly increases and has now passed the 50 percent mark.
